This indicator simply determines if the relationship of the close was close to the High or the Low of the day and provides you with a ten day running total. You are allowed to adjust what the actual proximity of the extreme parameters must be in order to be counted. The default is 10 for the low and 90 for the high.
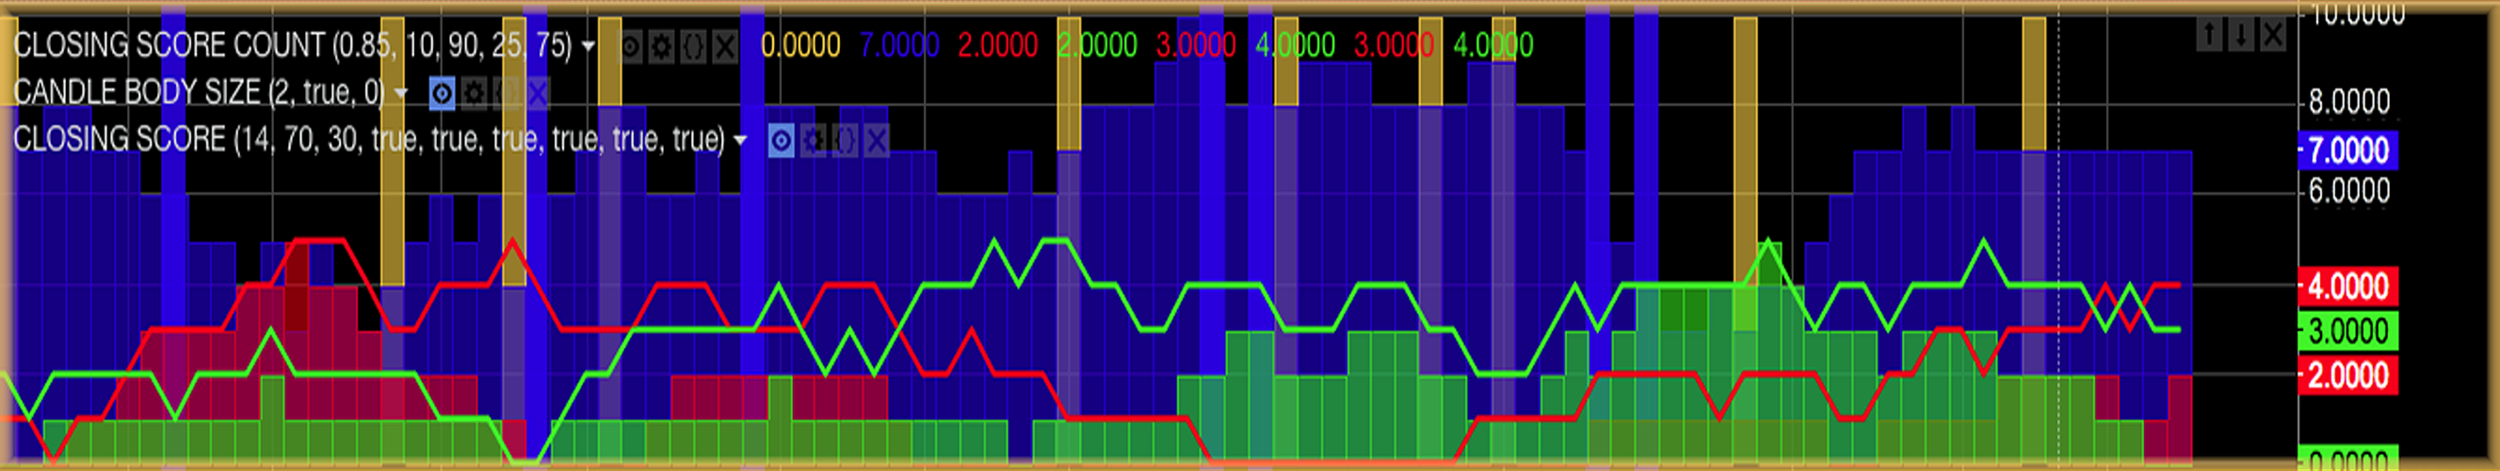
This indicator takes a ten day cumulative look at the Closing Scores, close to the low shown in red. The Closing Score's close to the high, show in green and finally the ten day count of the occurrence of long tails. Since this is calculated over a 10 day period of time, the scale is between 0 and 10.
Here again, you have an additional tool that provides you with the current sentiment, but just as importantly, how that sentiment is transitioning over time.
The blue columns indicate trading days that produced long tails and again provides you with a ten day running total. Because most institutional and all program trades are designed to be executed with a specific price range, when retail traders' orders are filled outside of these parameters the only orders remaining to fuel the market are orders who's prices are bracketed and thus will revert the trading range back into this channel producing a long tail in those trading days. Of course, there are other circumstances that can cause long tails, but when you see a series of days that all have long tails and the price trend is not changing dramatically combined with approximately equal trading volume for those days, you are in all probability seeing institutional and / or programed trades. You want to see this indicator above 8 before it is meaningful in my experience. This is a very good thing to see if you are looking for stocks about to make a dramatic move and more often than not it will be to the upside.
Access this Genie indicator for your Tradingview account, through our web site. (Links Below) This will provide you with additional educational information and reference articles, videos, input and setting options and trading strategies this indicator excels in.


This indicator takes a ten day cumulative look at the Closing Scores, close to the low shown in red. The Closing Score's close to the high, show in green and finally the ten day count of the occurrence of long tails. Since this is calculated over a 10 day period of time, the scale is between 0 and 10.
This indicator simply determines if the relationship of the close was close to the High or the Low of the day and provides you with a ten day running total. You are allowed to adjust how close the extreme parameters must be in order to be counted. The default is 10 for the low and 90 for the high. Here again, you have an additional tool that provides you with the current sentiment, but just as importantly, how that sentiment is transitioning over time.
The blue columns indicate trading days that produced long tails and again provides you with a ten day running total. Because most institutional and all program trades are designed to be executed with a specific price range, when retail traders' orders are filled outside of these parameters the only orders remaining to fuel the market are orders who's prices are bracketed and thus will revert the trading range back into this channel producing a long tail in those trading days. Of course, there are other circumstances that can cause long tails, but when you see a series of days that all have long tails and the price trend is not changing dramatically combined with approximately equal trading volume for those days, you are in all probability seeing institutional and / or programed trades. You want to see this indicator above 8 before it is meaningful in my experience.
This is a very good thing to see if you are looking for stocks about to make a dramatic move and more often than not it will be to the upside.

As do all other SDG indicators, volume spikes as determined by a center of gravity calculated over an eight day period. When these spikes occur and are two times greater than the COG the background color of the indicator turns blue. If it breaks three times COG the background color will turn white.
Inputs for this indicator, “UPPER CLOSING SCORE TRIGGER” and “LOWER CLOSING SCORE TRIGGER” allow for the user to determine where positive and negative signals are cutoff. I set them at 70 for the positive indicator and 30 for the negative indicator. Neutral numbers, those ranging between 31 and 69 do not provide enough certainty to help assist in your trading decisions. This will have the effect of removing all dots from consideration within the indicator, that do not meet your own personal criteria.

If you got to this page without first reviewing the Closing Score page, it will add a significant amount of meaningful information to this indicators output.