

Trend trading has a storied and exciting history. Many fortunes have been made and documented using this trading technique. The most famous stories revolve around a group of novice traders; the Turtles. This diverse group of neophyte traders were taught to trend trade by two experts: William Eckhardt and Richard Denniss. They were introduced to a systematic, step by step set of (at the time secret) instructions, provided a funded million-dollar trading account, and basically abandoned to sink or swim. The vast majority of them went on to become multi-millionaires.
“The Turtles were taught not fixate on when they entered a market. They were taught to worry about when they will exit.”
If your read Michal Covel’s book on “The Complete Turtle Trader,” you will see that the greatest difficulty these traders encountered was accurately determining when the trend was ending. They were taught that it was imperative to remain in the trade as long as it was above their moving average threshold. This required them to hold their positions even when their stocks or commodities where encountering high volatility, whipsaw movement or even short term down trends. The Turtle trading rules stipulated that they could enter a trade any time after the equity made a new 55 day high. There was no leeway on when you were to exit, you got the hell out of Dodge the instant your equity experienced a 20 day low. Eckhardt and Denniss emphasized that; where exactly you got into the trade was far less important than when you exited the trade.
Successfully trading the Turtle Trend Trading system was and is dependent on Risk Management incorporating volatility to adjust you position size.
Trend trading, by any name can be a profitable endeavor if you adhere to a simple set of trading rules and apply reasonable risk management. SWING•GENIE now provides you with both of these tools.
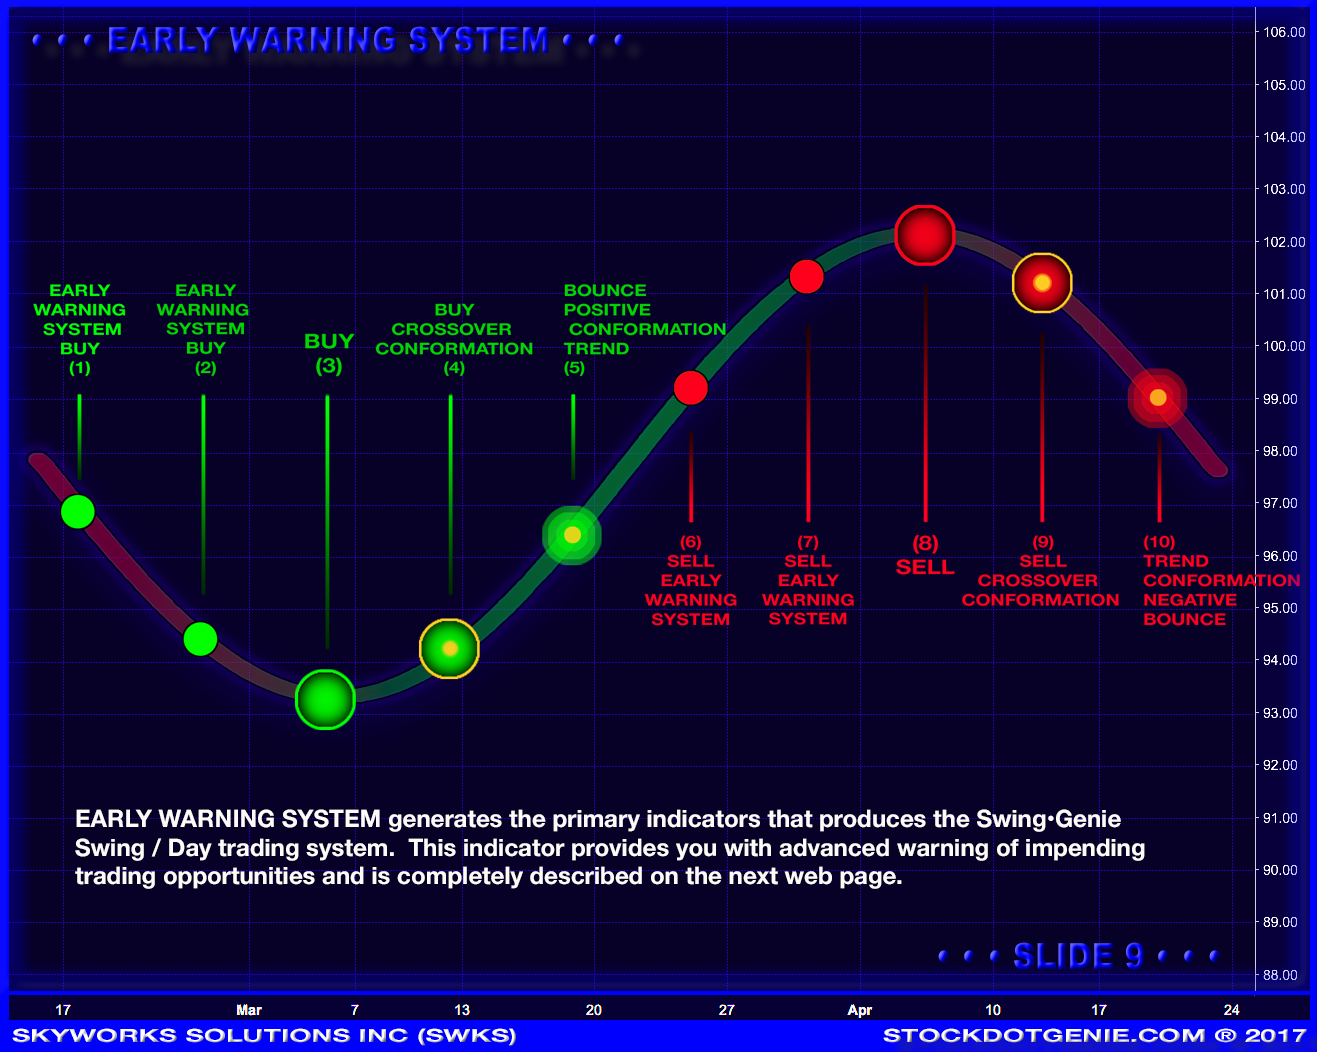
• The first indicator added to the GENIE package provides is the MOTREND indicator. It provides the trader with two signals within one indicator, communicating 1) the emergence of a trade-able trend, 2) the continuation of that trend, 3) its strength or momentum and 4) finally alerts the trader to the point in time when this trend is no longer your friend.
• The VOLATILITY TRADE OPTIMIZATION indicator provides the trader with a simple set of steps that will very quickly inform the trader what amount of his trading equity to put at risk and adjust how many shares to purchase based upon your allocation of funds and the current volatility of the equity in question. High volatility and the number of shares are reduced, low volatility and the number of shares are increased.
Both are fully described on there own web pages: (LINK) (LINK). Combined with the other indicators included within the Trend trading Package (2), you're provided with a systematic, complete and profitable set of Trend trading tools.

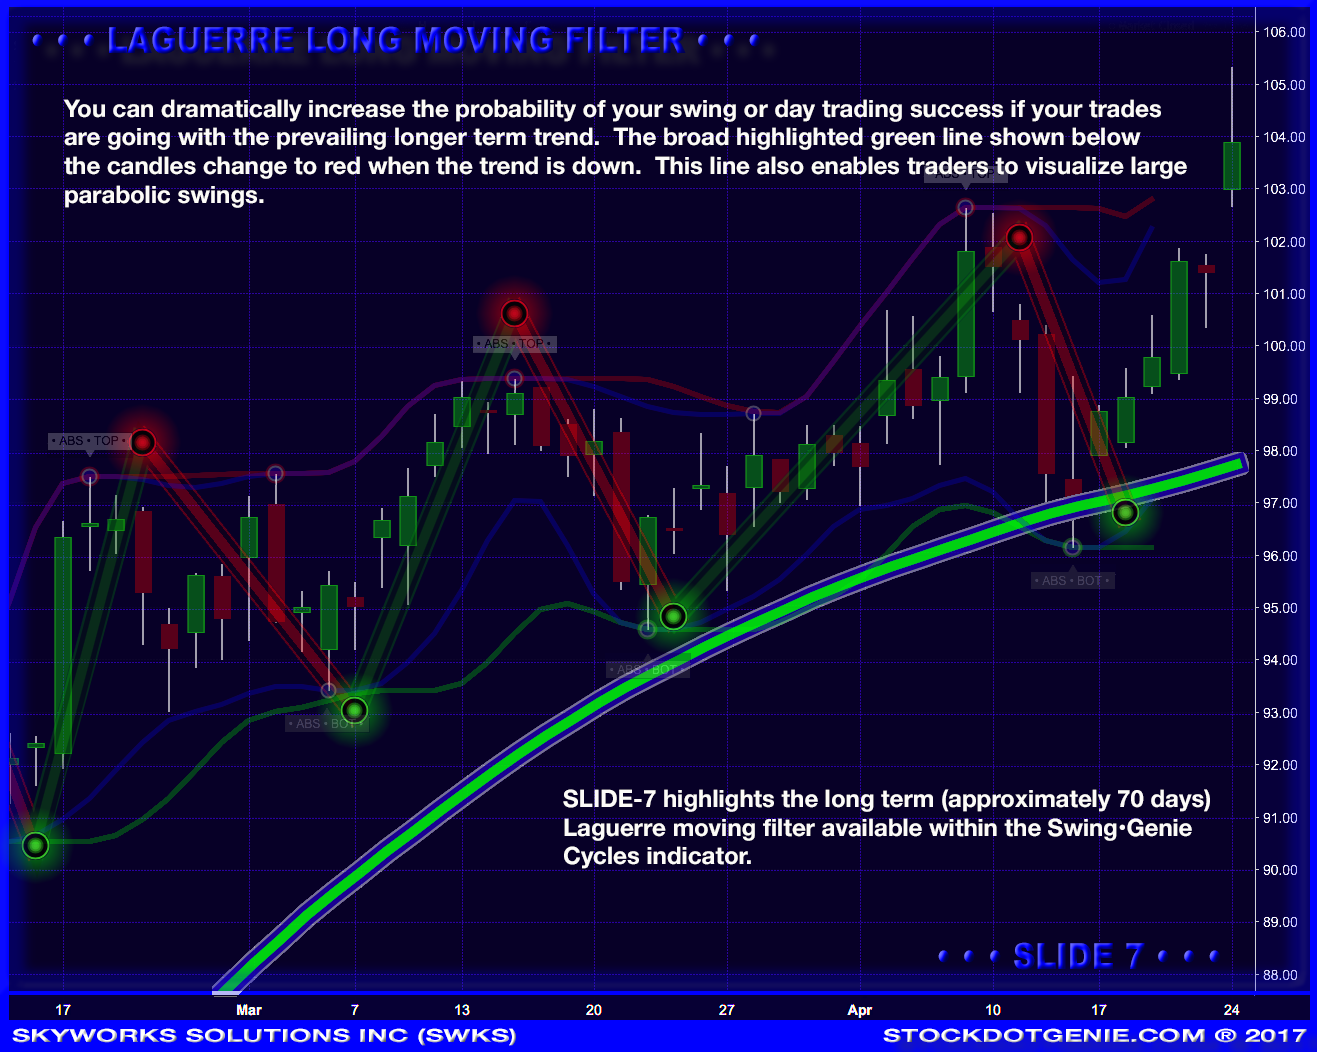
The ultimate advantage of the ALMA component of this filter is the ability it provides to traders, to adjust the data window allowing the primary entry/exit signals to be dialed in exactly at the optimal spot between the Early Warning Indicator dot and the Cross/Over dot. Because this system was initially designed for swing traders who’s time frame is normally a few days to a few weeks, the look back periods are short. ALMA greatly improves Swing•Genies ability to dial in these short time frame filters with as few whipsaw trade indications as possible. These same attributes also enable the day traders to alter trading time frames to very effectively utilize this indicator.
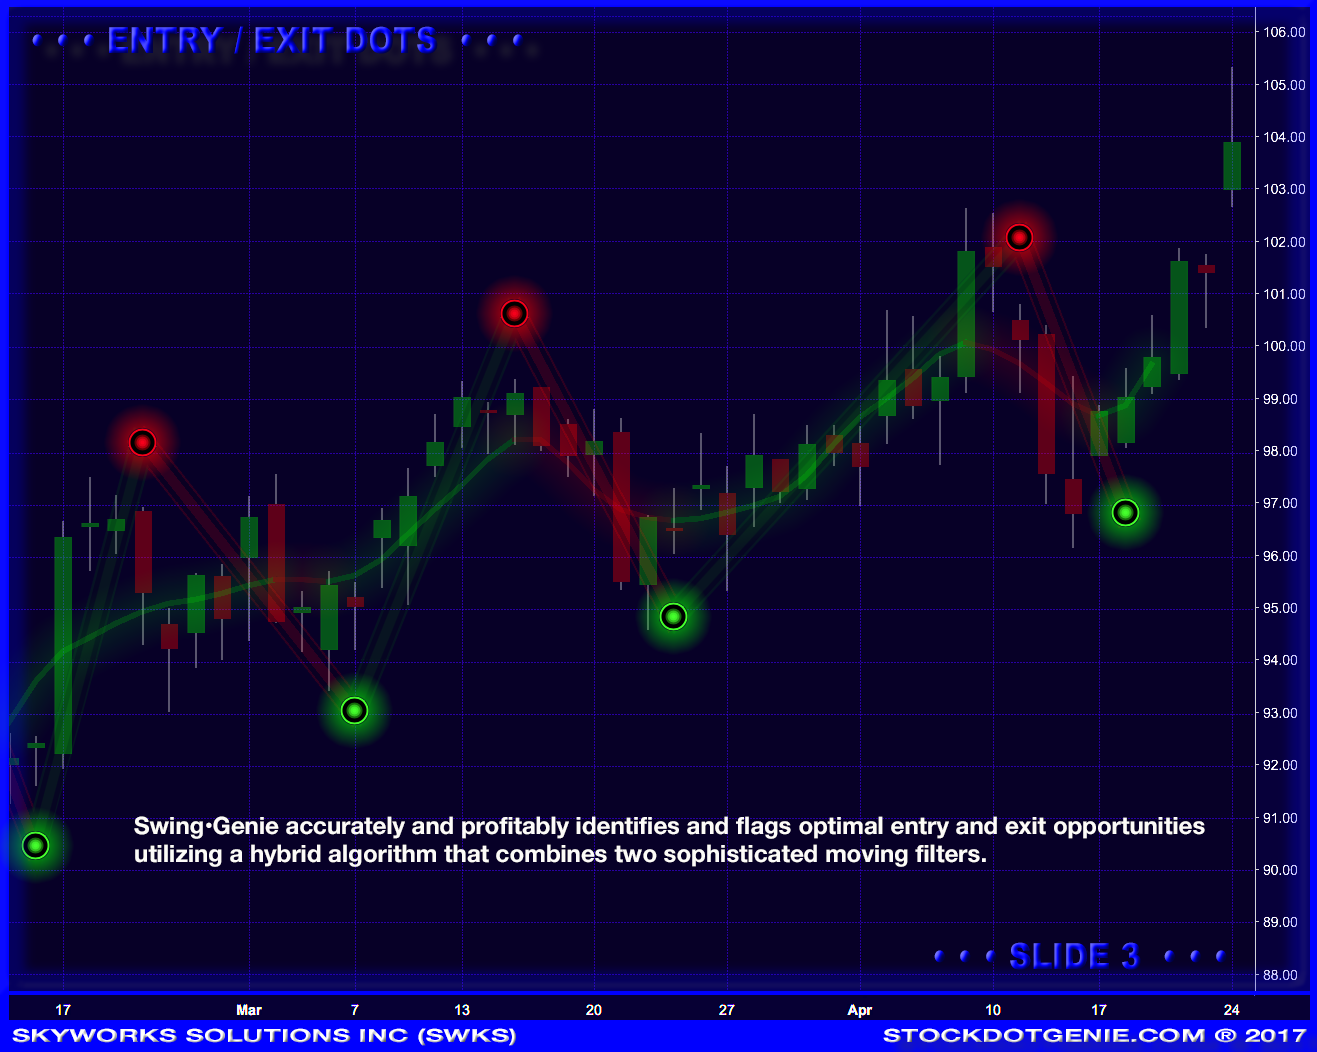
All stocks produce parabolic swings using price and time to calculate and draw the arc's that lead to the pinnacle of the peaks and the absolute bottom of there troughs. This is regardless of the time frame you choose to trade in. When similar patterns recur at progressively smaller scales, they are identified as fractals. This fractal property of price and time in the stock market is what allows Swing•Genie to excel at identifying optimal opportunities within the Trend, Swing or Day trading time frames. Swing•Genie signals, projected on your main trading chart are generated in tandem within the Early Warning System and the Cycle Indicators.
SWING•GENIE CYCLES SLIDE SHOW


Slides can be advanced by clicking on the large slide, using thumbnails above or the "<" ">" controls provided at the left and right edge of each slide.
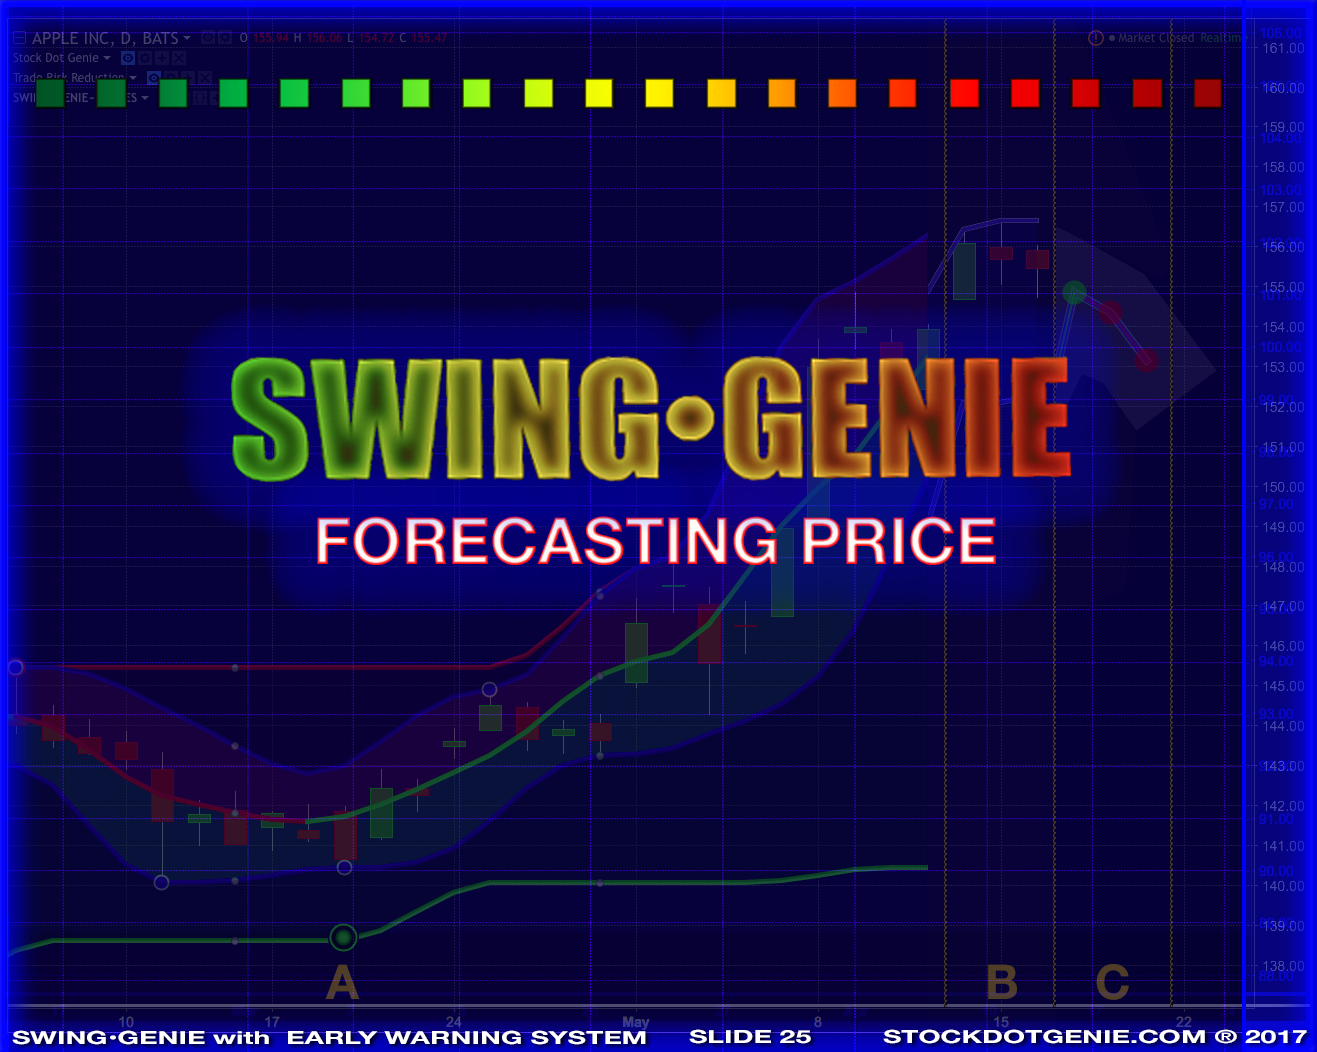
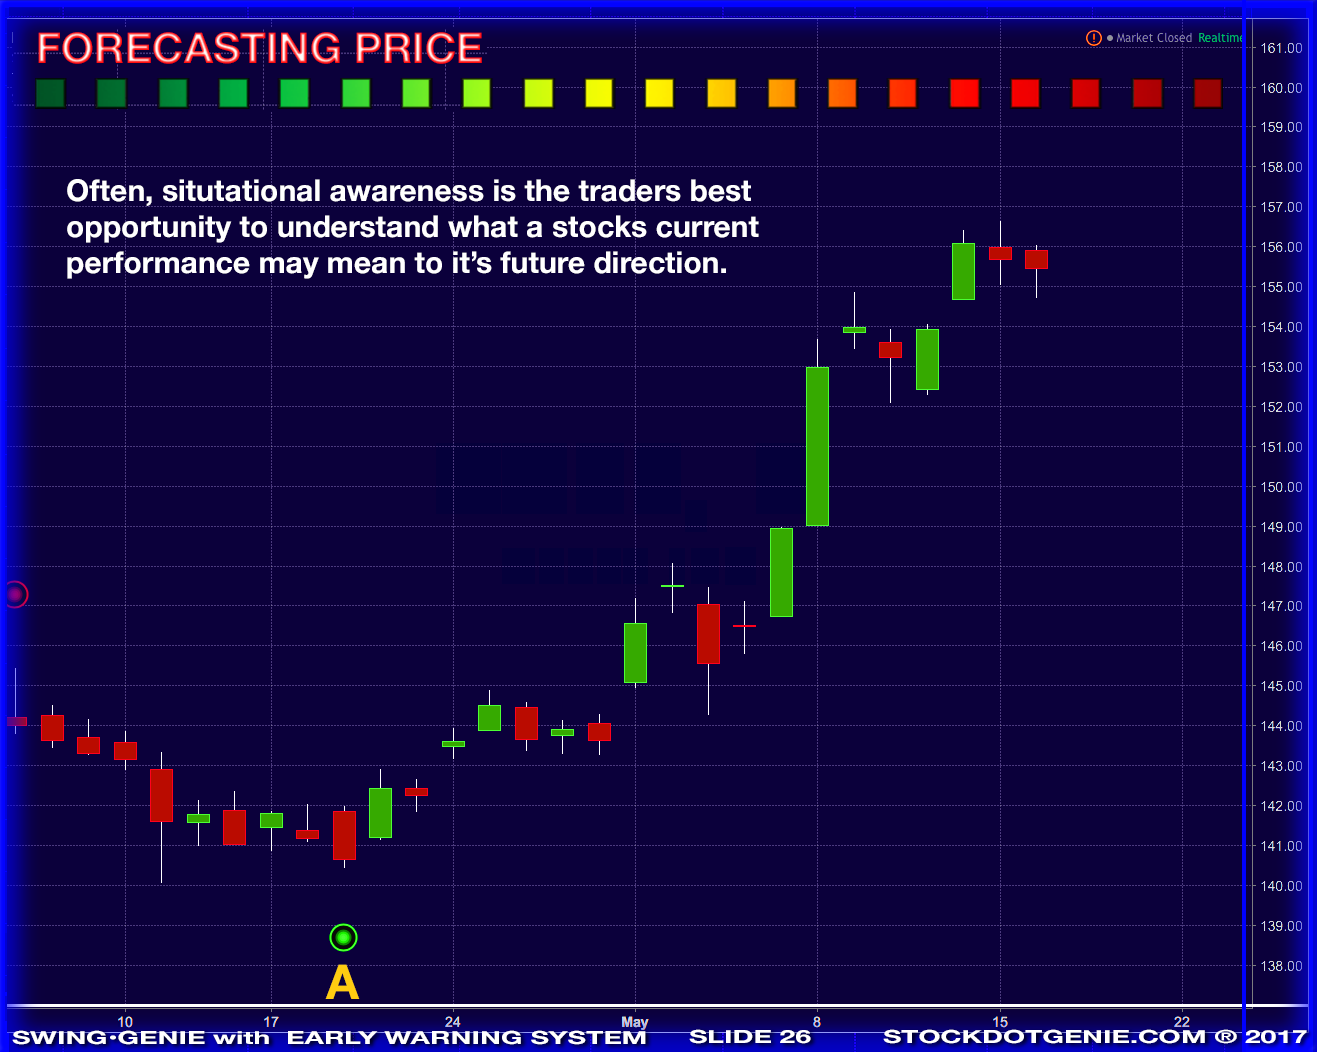
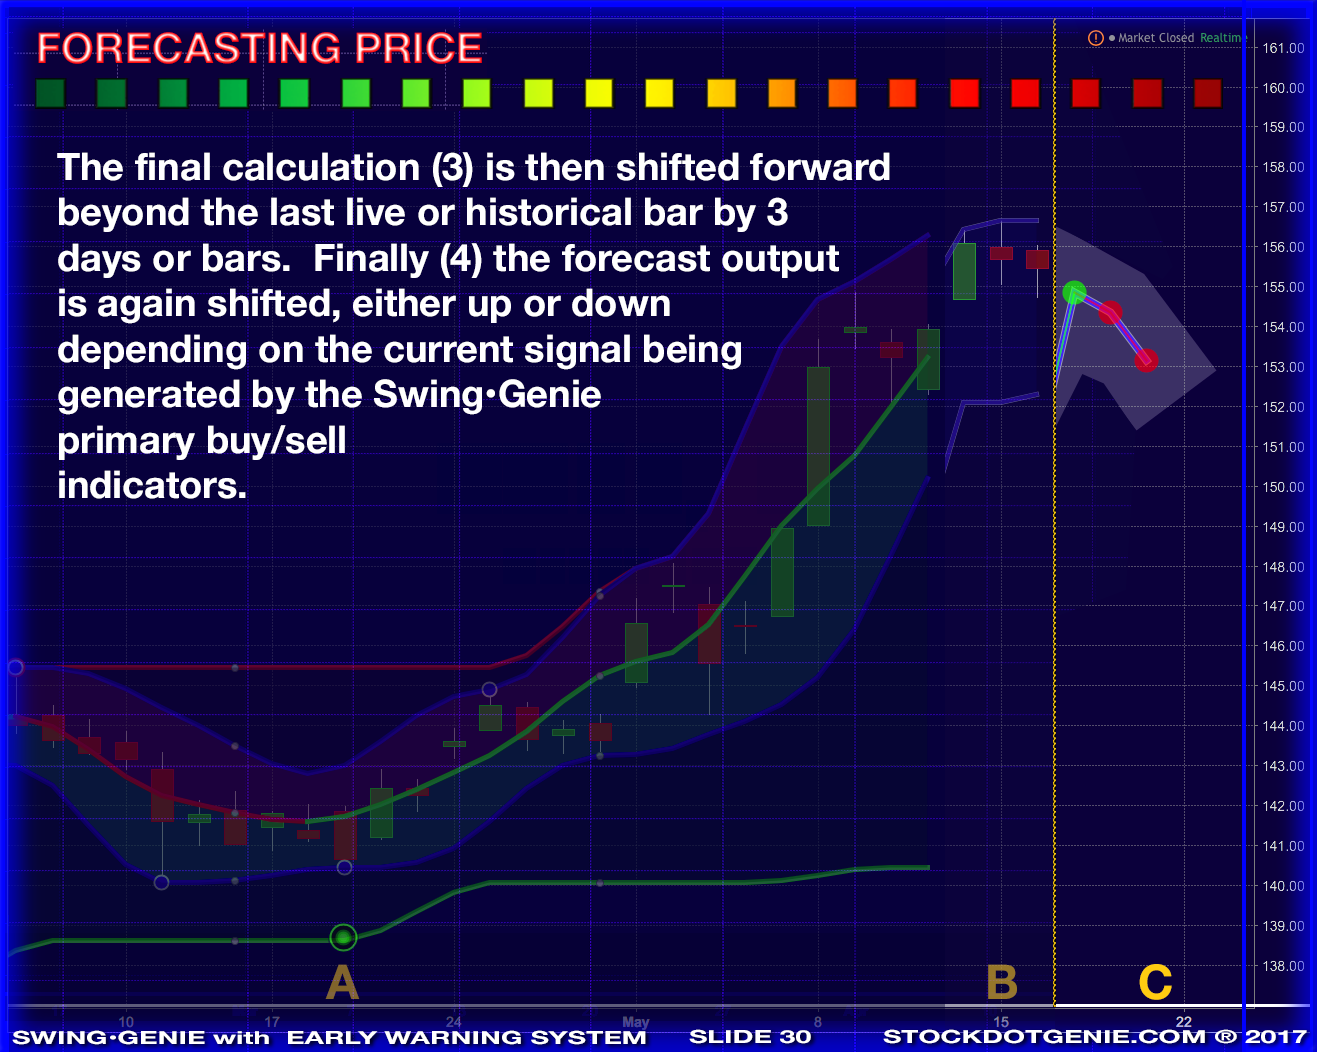
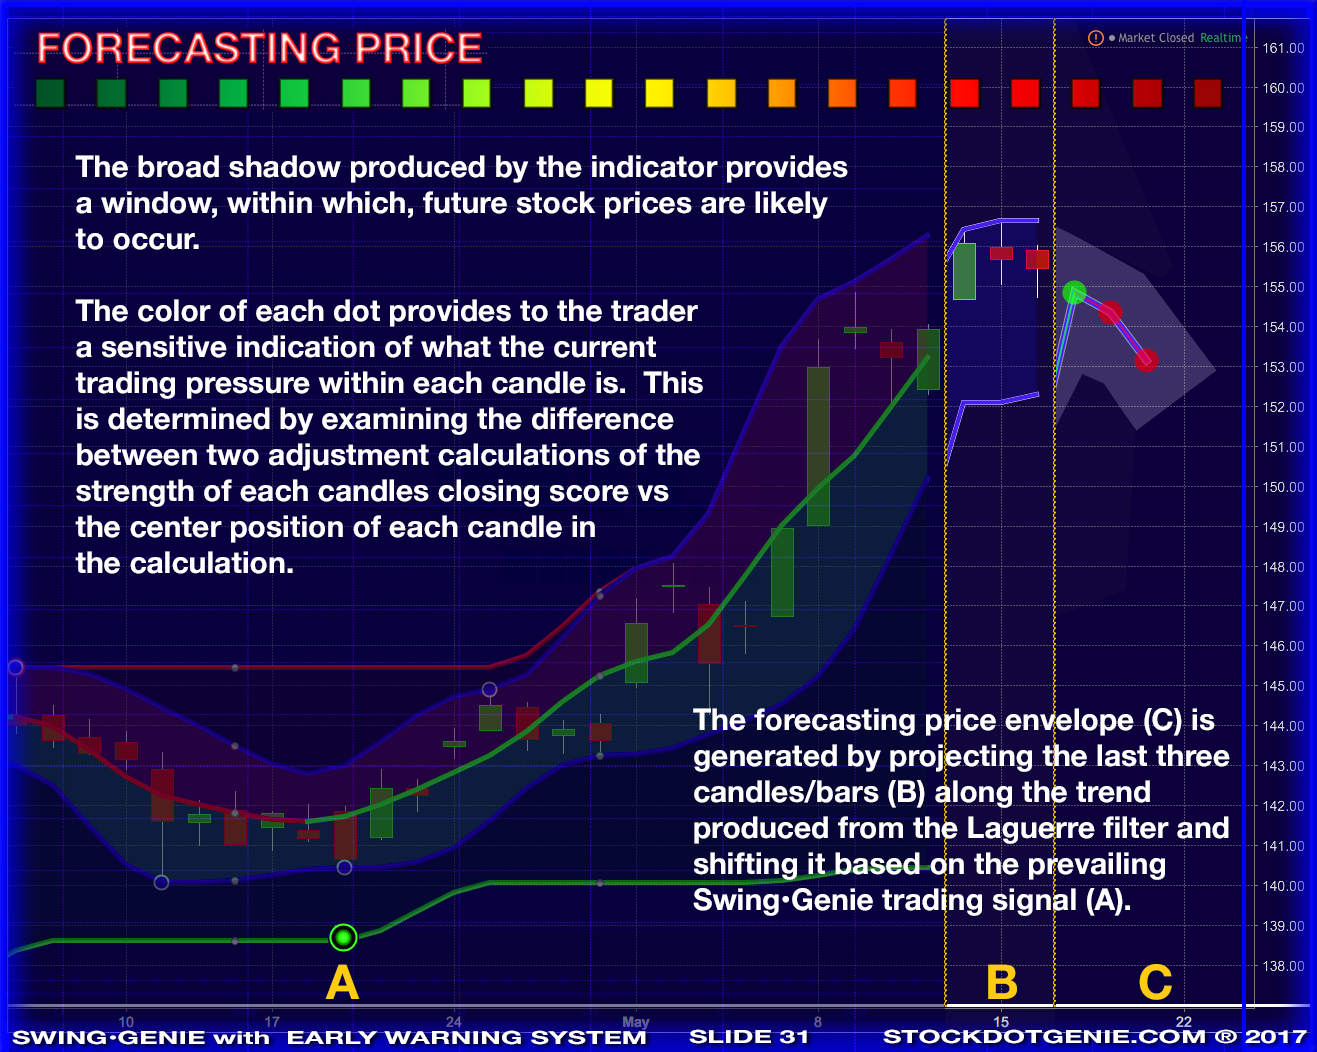
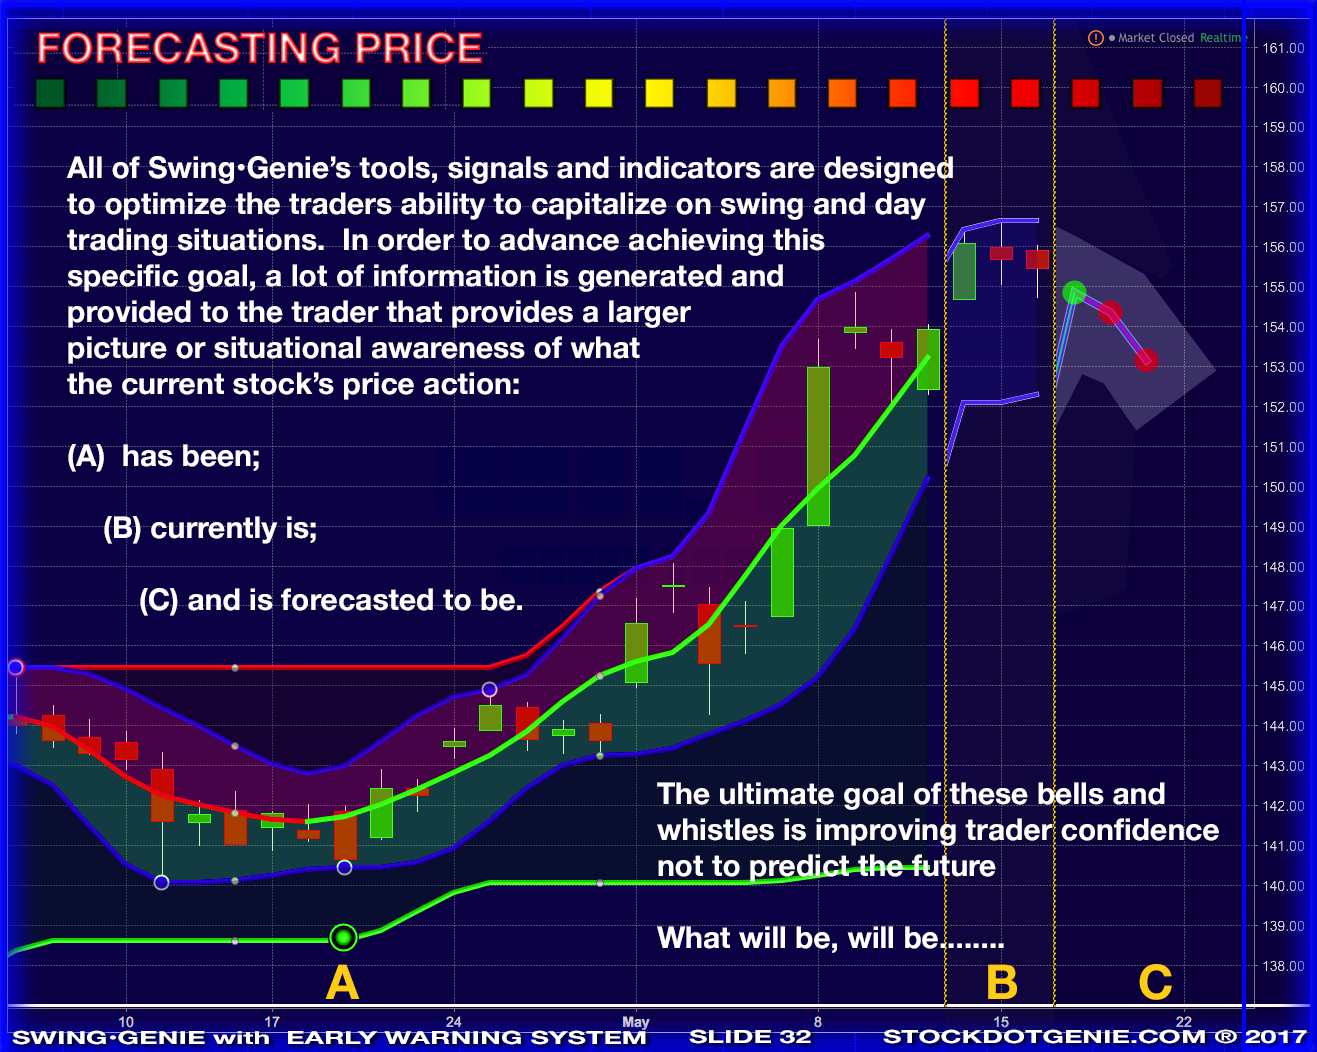
Forward Projection of Current Price Trends
Any technician attempting to forecast what future prices will be, is engaging in technical analysis, hocus-pocus. Current methods being utilized to accomplish some level of success in forecasting price are detailed in the TASC article describing the Swing•Genie indicator. It is, however, possible to simply project the current price action forward a few bars with the expectation that the current trend will continue on the approximate arc that is being fellowed by the equity. This provides to the trader a visual projection of the potential price action, but in no way is it any guarantee that prices will actually fellow this tract. The fellowing slides provide a detailed explanation of how Swing•Genie price forecast is calculated so that the trader can understand exactly what credence and confidence to give to them. Hurst Laguerre channels are also touched on in the following slides. For a complete Hurts cycle explanation, scroll down this page to a dedicated slide.

JM Hurst developed a trading system (Hurst’s Cyclic Theory) to clearly display the cyclic harmonics that exist within multiple time frames. Hurst theories attempt to deconstruct the fractal hierarchy of an equity and determine alignments and convergences. He produced two books on this system in the 1970's and several books have been authored by individuals who were advocates of Hurst's published theories. Many trading message boards have threads on Hurst cycles with multiple descriptions of various methods to calculate, code and execute trades based on signals generated by these indicators. In addition, many institutions and hedge funds incorporate some version of Hurst cycles into their trading protocols and algorithms.
Three images taken from "cycles course," J.M. Hurst; Traders press inc. GREENVILLE SC copyright 1973
The primary principals of Hurst cycles are price moves in waves (See illustration above) that exhibit cyclic attributes based on their time scales. Although the concept may seem simple, the execution utilizing the lessons and incorporating the finer points from Hurst's second book, "Cycles Course," can be very difficult to correctly and profitably apply. Strong signals are generated by Hurst cycles when cycles of different lengths have peaks or troughs that converge.
There have been many different attempts at executing Hurst cycles as a Technical Indicator. Most of those attempts have been centered around displacing moving averages backward to center or align the different lengths so that the troughs and peaks align with the highs and lows of the current stock cycles or swings. This displacement is usually 1/2 of each of the moving average lengths utilized. This produces a setback of the active signal causing it to end many bars prior to the most current bar.
Because this ends the moving average indicators signals as many bars back as the displacement, no current or real time indication is provided. With prior cycles highs and lows as a guide, combined with the current trend, an artificial signal can be produced, projecting the indicator forward. This determines the current trend based on the last X number of price points in the chart starting where the indicators setback ends.
• Laguerre Hurst Cycles •
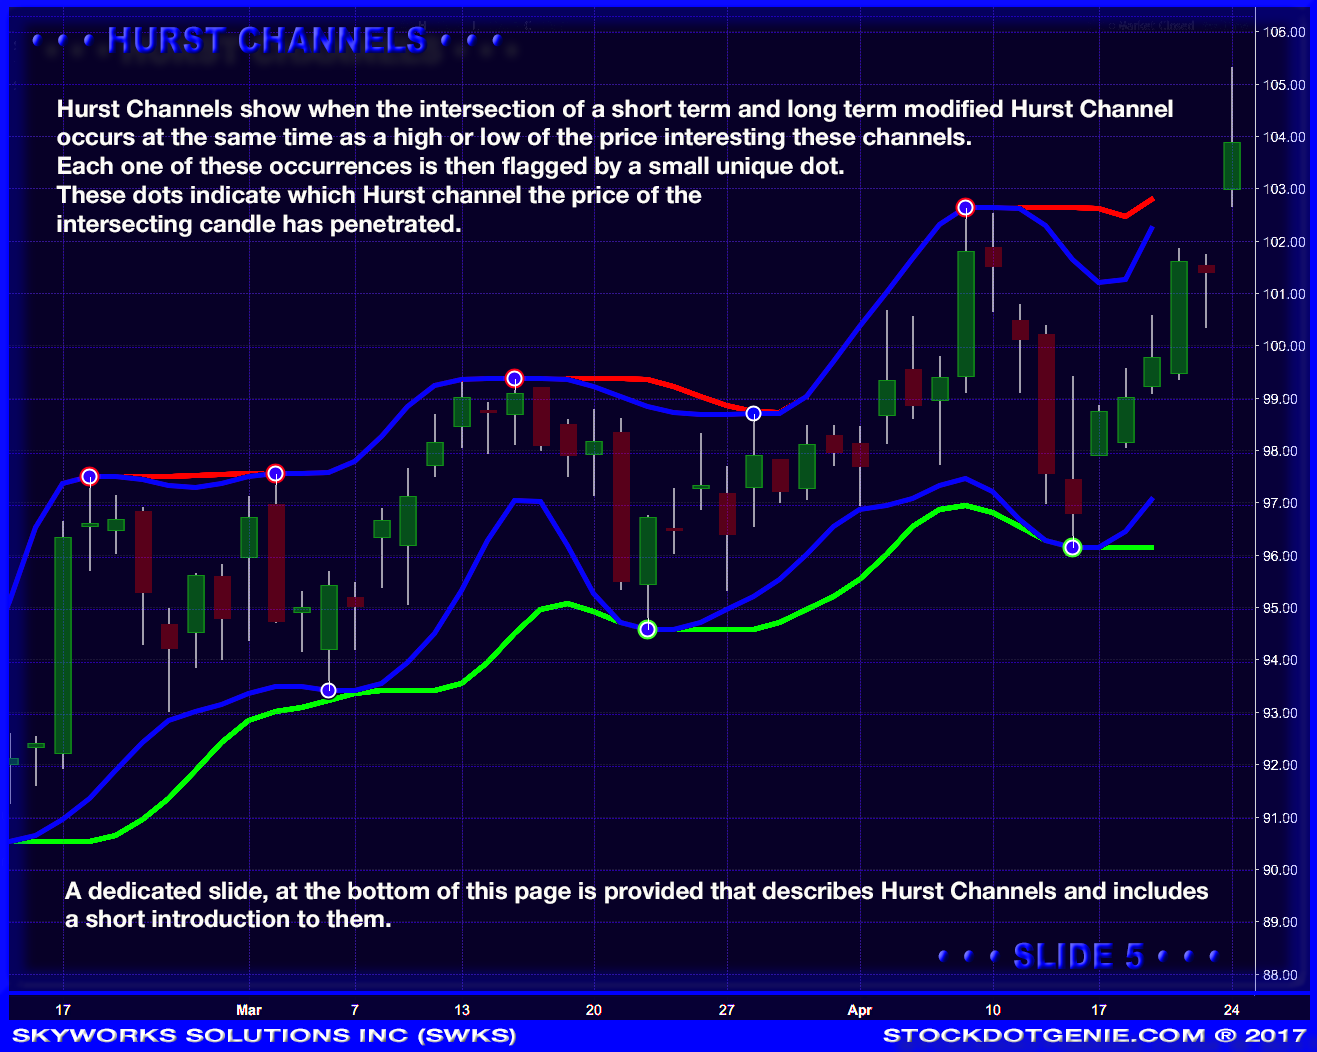
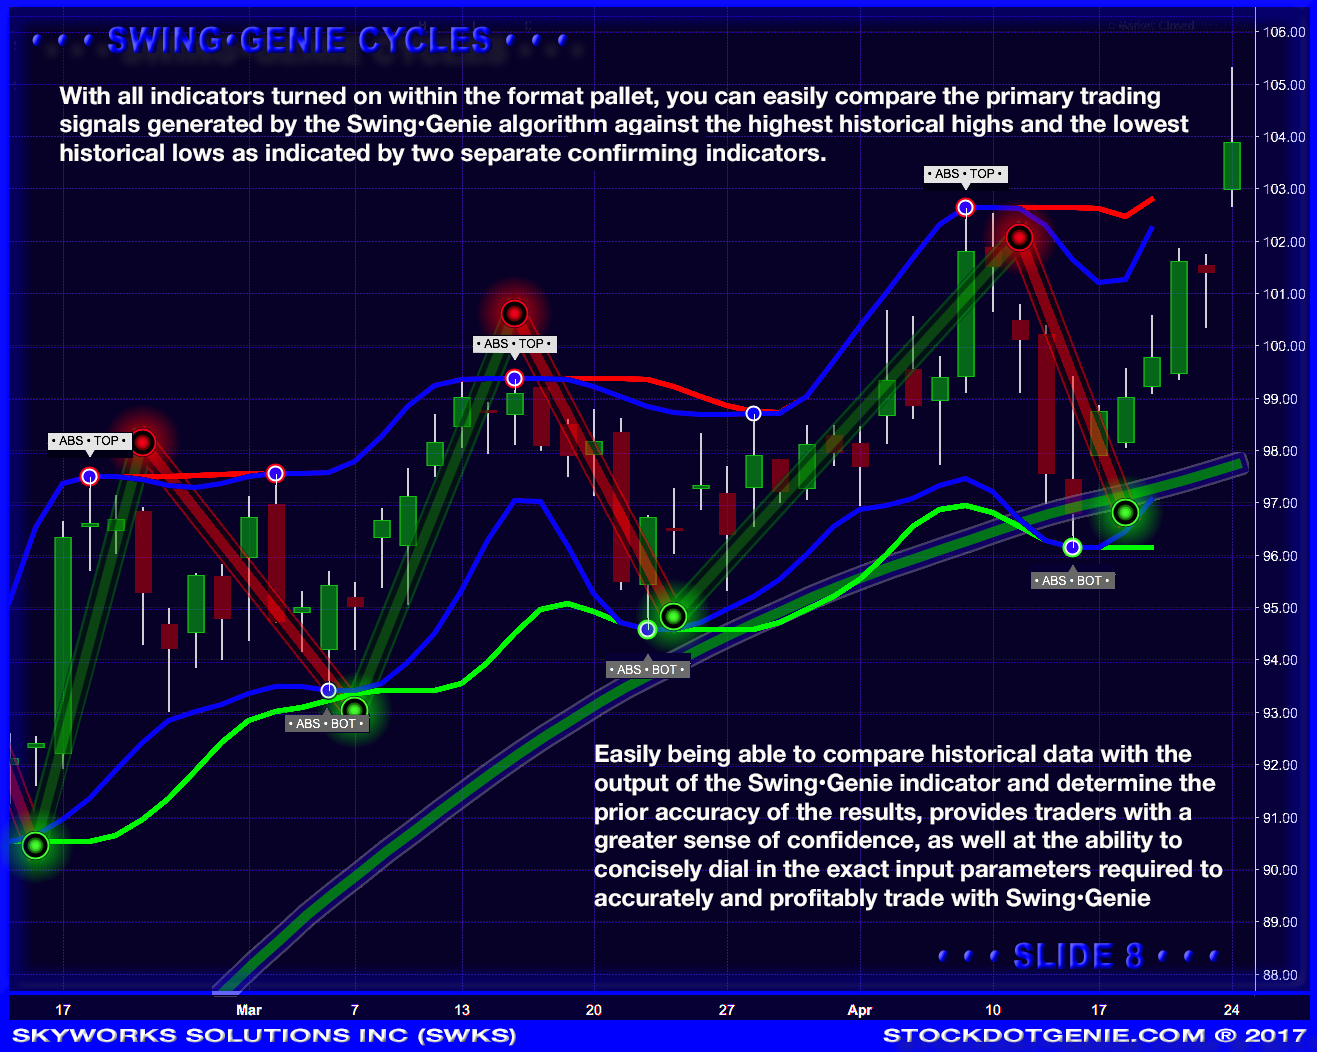
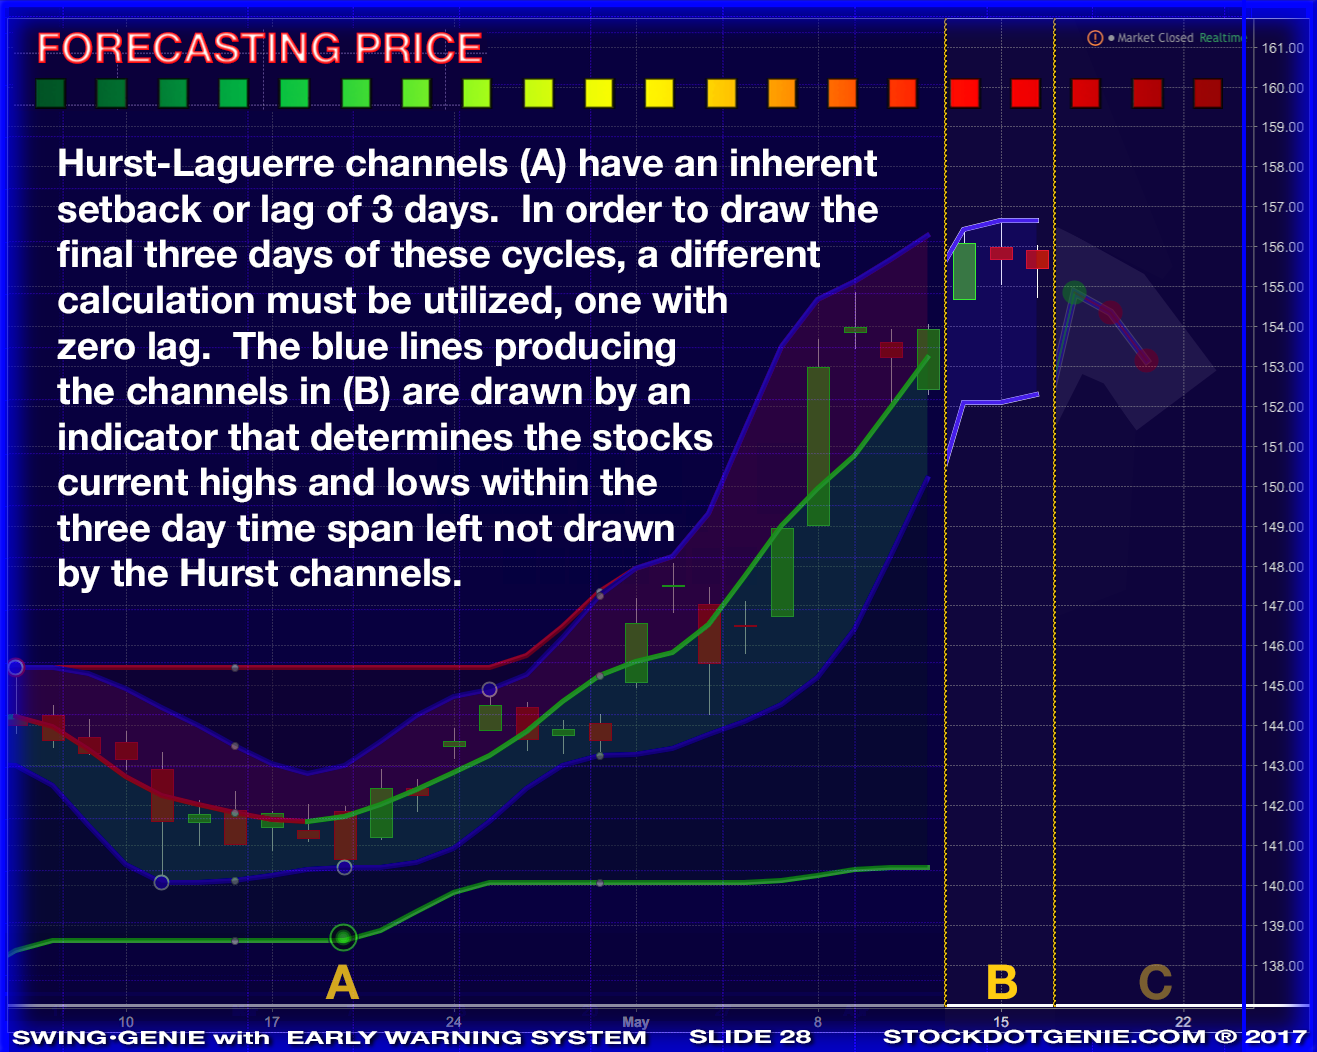
Swing•Genie Cycles incorporates Hurst cycles theories but utilizes only two nested Laguerre moving filters. Laguerre moving filters have significantly less lag and the setback required is only three days/bars. These moving filters take as there inputs the highest high and the lowest lows for the two adjustable periods. The point of the indicator is to determine when a short term swing cycle harmonizes or aligns with a long term cycle, i.e., determining when the tops and bottoms of these cycles align. The default intervals utilized in Swing•Genie Cycles are short period of 5 days and the long period of 20 days. Each equity can have unique cycle lengths and the Swing•Genie Cycle Indicator allows you to change these parameters in the formatting/input pallets.
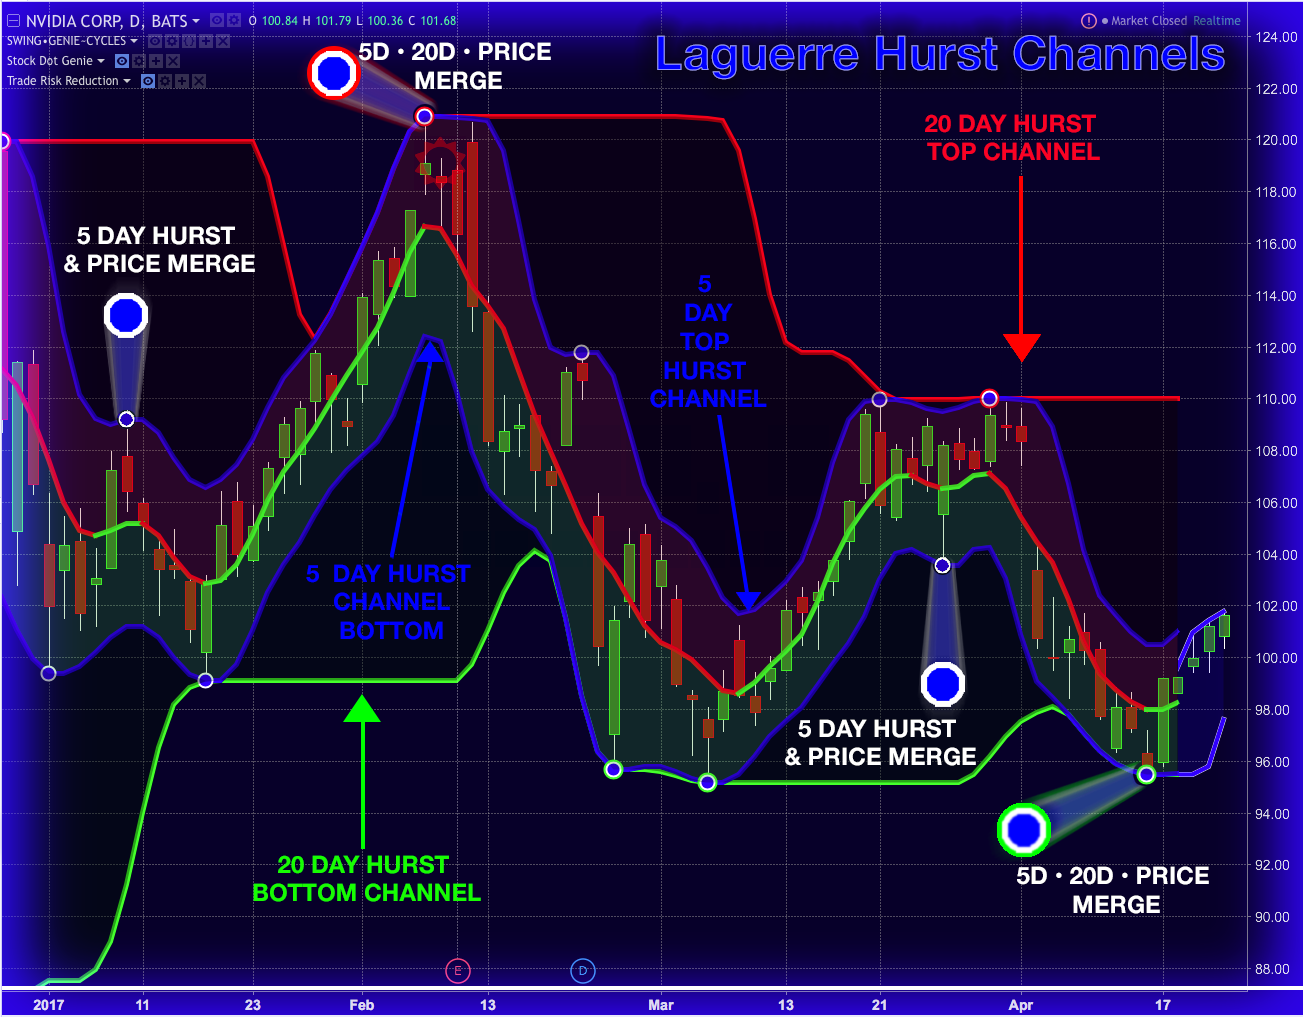
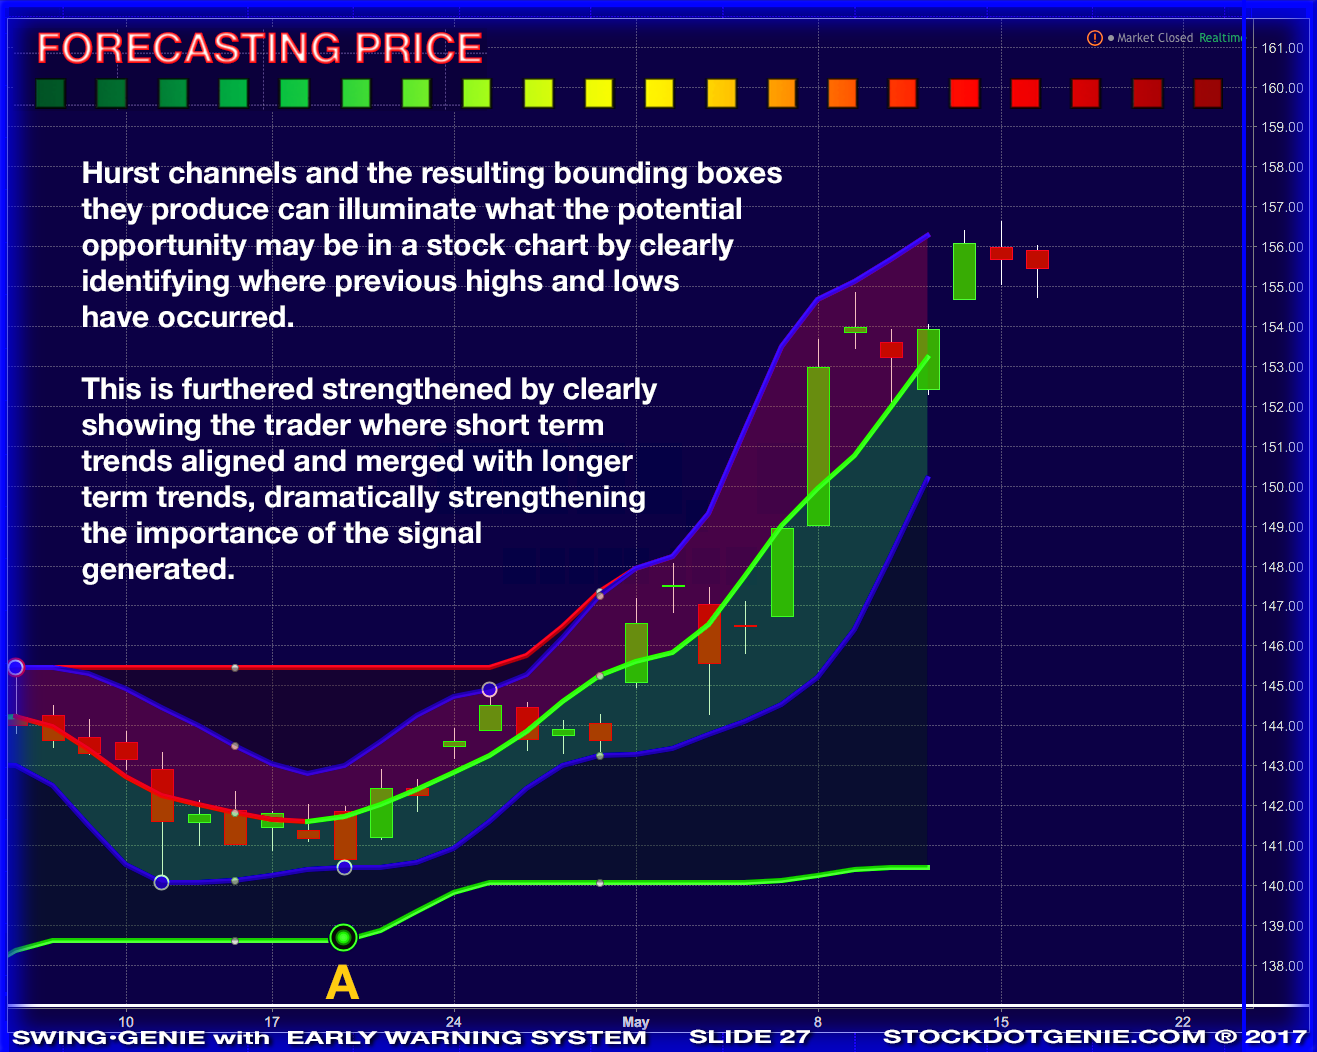
Because the Swing•Genie Laguerre cycles utilize the highest highs and lowest lows of two time periods, the nested channels produce natural bounding boxes. This dramatically highlights likely support and resistance levels as they often occur at prior highs or lows that this indicator is drawing.
This provides the trader with a high probability gage of the profit that can be expected from your entry into a trade executed at these demarcation lines.
If the entry point is at the shorter interval, then the upper limit of this trade in likely to be the upper band of the short term channel. If the entry is at the convergence of both the short term channel's lower band and the long term channel's lower band then your trade potential is the high band of the long term channel. This inflection point is obviously stronger and results in a much higher probability of success and more sustained and profitable entry positions.
This obviously produces another indication that your trade may be approaching an inflection point and turn against you as you approach the upper demarcation lines.
Every time the high or low of the bar touches either bands, top or bottom, an intersection dot is produced. These dots are blue/white if they are touching the inside 5 bars band and red/white/blue or green/white/blue if they are touching the upper or lower, 20-day bar, longer length time period channel.
These double dots produce entry and exit signals with the greatest potential. The exception to this statement is when stocks are very strong trends and continually bounce off of the upper or lower limits of the long term channel.
BACKGROUND FLAGS INDICATING SENTIMENT & CONSOLIDATION

Closing Score Sentiment allows you to turn on the color coded background you see below. Red will coincide with a negative trend and green indicates a positive trend. Each is indicating what the prevailing market/trader sentiment currently is. You can read a complete explanation of Closing Score Sentiment here.

The control panel allows you to control the intensity of these sentiment background flags.


