


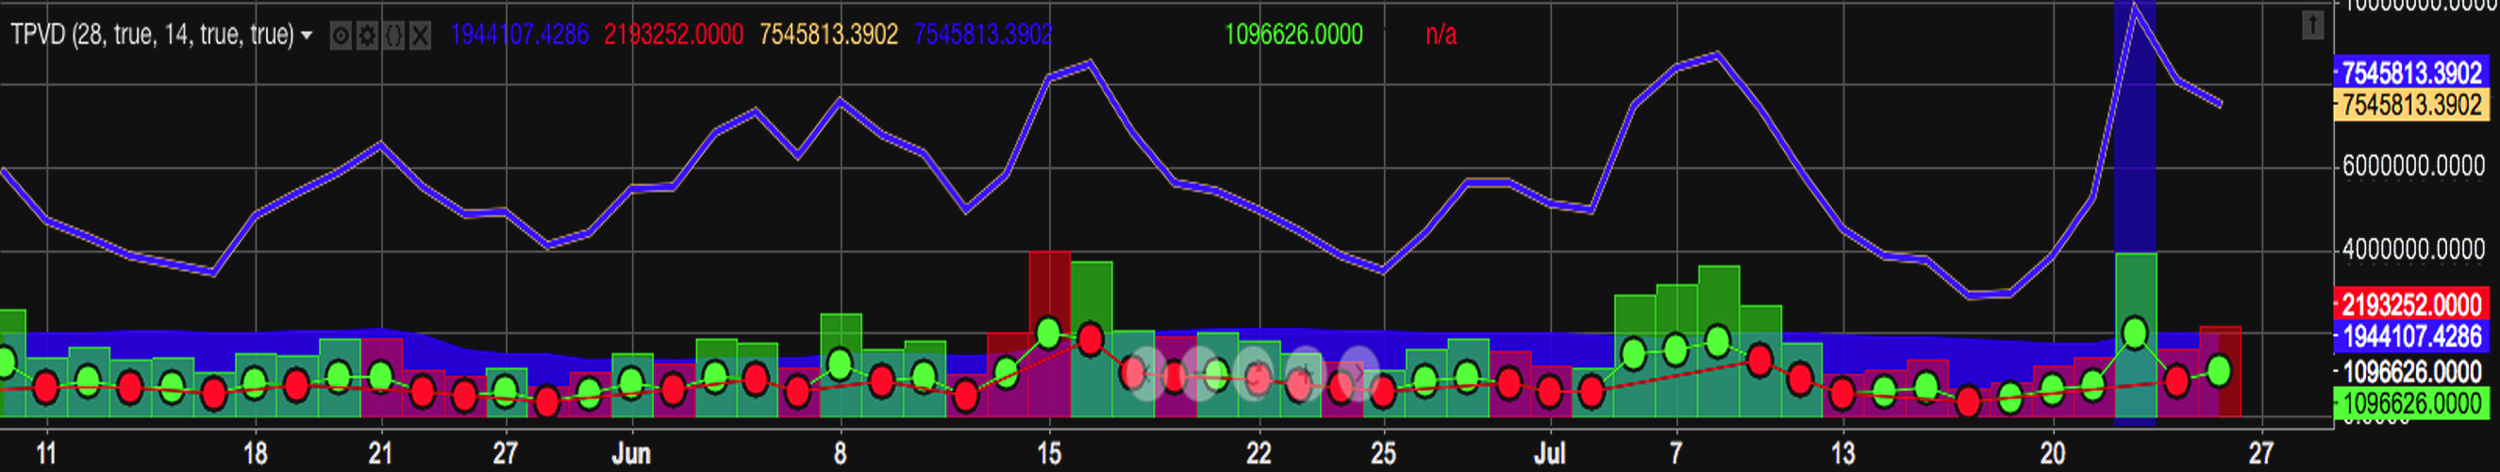
Although dramatic increases in volume can accurately reflect the sentiment of changes in price, small changes do as well. Think of it this way. Every share sold or purchased is a vote for or against the current price action. If the price has gone up today and the volume also went up, compared to the previous days volume , the votes of the majority of the traders that produced this volume agreed with the sentiment that this price change represented. If the volume was suppressed on this price increase, that sentiment was not confirmed. This provides you with a very good window into the collective minds of traders allowing you to judge every candle, every indicator and every price action in a much more initiative and accurate way. The SDG Turning Point Volume indicator again utilizes a dot system to easily allow you to see in a glance if the volume is confirming the price action sentiment ( green dot ) or if it is discounting the price action (red dot.)
There are many situations where volume alone can indicate important inflection points in an equities direction. It may not even reverse direction, but an abrupt change in the rate of change , can be a very profitable entry point – if you can see it coming and act in advance of some or most of the traders making this market.
Access this Genie indicator for your Tradingview account, through our web site. (Links Below) This will provide you with additional educational information and reference articles, videos, input and setting options and trading strategies this indicator excels in.


There are many situations where volume alone can indicate important inflection points in an equities direction. It may not even reverse direction, but an abrupt change in the rate of change, can be a very profitable entry point – if you can see it coming and act in advance of some or most of the traders making this market. This page and it accompanying indicator, Turning Point Volume, describes several of the most important situations that provide opportunities for traders to anticipate what the markets will do with a very high probability of success. To capitalize safely and effectively on these opportunities the trader needs to obtain the situational awareness that is discussed on the Traders Links page. In many was you should consider volume in these situations, not so much as a technical analysis indicator, but as a social analytic. If you have never read anything on Wisdom of Crowds you should add that to your to-do list. Here is a TED presentation by the author of the book by the same name, James Surowiecki.

Dramatic increases in volume represent more individuals and more institutions buying more shares than they have over the recent history of the stock. This can be considered as a social sentiment indicator because these situations are directly reflecting the attitudes of the traders through the price action change. More importantly, if the price has not changed or has changed very little, you have a leading indicator that allows you to enter or exit in advance of an impending change in this stocks trend or turning point. This phenomenon of small changes in price, but a dramatic increase in volume if called churning. The lead is completely dependent upon your ability to discover what is driving this increased volume. All turning points are opportunities and a dramatic change in the equities volume is one of the best indications you are going to ever receive that one is about to occur. An old and useful saying is "Volume precedes price.
When ever you see a blue or white background flag behind your SDG indicators, you want to start monitoring news on that stock immediately. Turning Point Volume monitors Volume using a Center of Gravity indicator for an 8 day period,(COG8V). If COG8V is 1.6 times greater than a smoothed moving average of the same indicator for the previous 28 days, then the background of all indicators is painted dark blue. If this COG8V is 3 times greater than the 28 day SMA then the background is painted white.
If you don't find the reason for this change then you are seeing traders acting on information that you don't, as yet, have access to. Determining if you are seeing a risk or an opportunity becomes your job. There is an Easter egg out there somewhere that contains a prize, but only for those who discover, understand and act on it first. Google Alerts and Google Trends are two good leads for teasing this information out. Other sites that have good mining prospects are Yahoo's message boards. Just go to Yahoo Financial site and enter the ticker symbol. On the left had side of the page you will see a link to this stock's message board. If you don't see an explanation of what is causing the increase in volume just post the question. Don't believe anything you get here until you find another reputable source to verify it. Review the SeekingAlpha website for this stock and read the most recent article's comments to see if the answer to why there is an increase in volume is being addressed here. This is one location where you will find many comments by individuals who are following this stock and who are knowledgeable about the company. There is less BS here but individuals opinions always reflect their desire to see a stock move one direction or another. Bias exists everywhere so absorb the information ad use common sense to distill the information into the picture that best fits the facts you can confirm independently.
Here is a scenario that is quite likely the explanation for the increase in volume. A strange thing happens when Insiders start talking about impending news that will dramatically influence their companies stock price. As insiders they are prohibited from disclosing material information to any outsiders. Of course in the face of any market shaking news, outsiders are often involved and these outsiders are often in the financial industries, including institutional traders, bankers, brokers, venture capitalist, and lawyers, just to name the few most obvious. Now none of these individuals are supose to devluge any of this information to anyone else. Somehow, girlfriends, boyfriends, brothers, sisters, moms, dads, ucles, ants, cousins, friends and sometime just plain stranges get ahold of this valuable information. How do I know this for certain. Look at any companys stock where dramatic news was released that had a potent and positive or negative impact on their stock price. You will notice that the volume starts to increase, rather strongly, several days in advance of any authorized press release.
Finviz and Barchart, both provide high volume scans that will provide you with a daily list of potential high volume candidates.

When you find a situation like this and you feel you know the reason for the volume spike, or even if you don't, please post it to our blog (SDG-TOO-BLOG). Our community will look for the underlaying reason for the spike. The "TOO" stands for Targets of Opportunity. You will be rewarded by others doing the same to compensate you for your hard work, research and generosity.

Although dramatic increases in volume can accurately reflect the sentiment of changes in price, small changes do as well. Think of it this way. Every share sold or purchased is a vote for or against the current price action. If the price has gone up today and the volume also went up, compared to the previous days volume, the votes of the majority of the traders that produced this volume agreed with the sentiment that this price change represented. If the volume was suppressed on this price increase, that sentiment was not confirmed. This provides you with a very good window into the collective traders minds allowing you to judge every candle, every indicator and every price action in a much more initiative and accurate way. The SDG Turning Point Volume indicator again utilizes a dot system to easily allow you to see in a glance if the volume is confirming the price action sentiment (green dot) or if it is discounting the price action (red dot.)

Finally, the lack of volume at strategic points in a stocks trading cycles can be just as important in allowing you to determine if a trend is ending or will continue.
Relative Volume Changes at Support or Resistance

Tim Ord published multiple articles on how to utilize volume as an predictive indicator in "Technical Analysis of Stock and Commodities." The title of that article was "Price + Volume = Price Movement." The article's title is linked to an online copy of Tim's article and it is well worth you time to learn what Tim has discovered about the relationships between price and volume. What is very important to remember here is Tim's rules only apply when comparing volume at Turning Points occurring at both the current and previous confirmed resistance levels or the current and previously confirmed support levels. You are seeking to determine if there is an increase or reduction in volume at these points. The chart on the right provides you with a simple reference to determine what Tim's process predicts. By simply determining the difference between the two relevant time points you are given a guide as to what will "probably" happen at the current support or resistance level.
Basicly the rules are: The stock will continue on it's current trend if there is a slight reduction (2% or less) or there is any increase in volume between the two time points.. If the difference is between a reduction of 3% and 7% no indication is produced. If you are seeing a reduction of 8% or greater you will likely see a reversal of the trend or a new Turning Point.
SDG's Turning Point Volume Indicator's, Input formatting palette, allows you to enter the previous support or resistance day as the number of days ago this occurred. This input is the "Number of days between Highs or Lows (Cycle Length)"
There are many other volume interpretations, the few discussed on this page in no way represents all of the possible interpretations of volume. As you go through the Traders Links you are bound to find many more.


